Browse all docsPart 6 of 8
Track Performance with Analytics
Read the analytics on each catalogue to see how many people view it, when they look, and what to do with that information.
Part 6 of 83 min read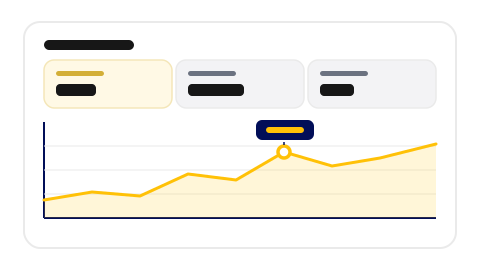
Once a catalogue is live, you do not have to guess how it is doing. Each one has its own analytics, so you can see how much attention it gets and when. You do not need to be a data person to use it. A few simple numbers tell you most of what matters.
What the numbers mean
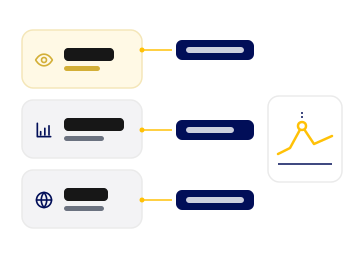
Total views tell you how much your catalogue is being opened overall. The busiest day shows when interest peaked, which often lines up with a post, an email, or a sign going up. Average views per day give you a steady baseline to compare against, so you can tell a good week from a quiet one.
The chart of daily views over time is where the story is. A steady line means steady interest. A spike points to something that worked, and a slow slide is a nudge to share the link again or refresh what is inside.
Turn views into decisions
Analytics are only useful if they change what you do. If views jump every time you post the link, post it more often. If a quiet stretch follows a price rise, that is worth knowing. Watch the pattern over a few weeks rather than reacting to a single day, and let it guide when you update and when you promote.
Was this helpful?